

Introduction to MiniDump on Windows 11
Windows 11, like its predecessors, is designed for stability and performance. However, even the most robust operating systems can encounter unexpected issues, leading to system crashes or freezes. When such an event occurs, your system often generates a crucial diagnostic file known as a MiniDump. These small but powerful files are essentially snapshots of your computer’s memory at the precise moment of a system failure. For additional context, see small memory dump, getting started with WinDbg, bug check code reference, Configure System Failure and Recovery Options, and Windows Sysinternals Suite.
Understanding what MiniDump files are and how to utilize them is an invaluable skill for any Windows 11 user, from casual enthusiasts to IT professionals. They act as digital forensics evidence, providing critical clues that can help pinpoint the root cause of persistent problems. Without these files, diagnosing complex system errors would often be a frustrating and time-consuming guessing game.
This comprehensive guide will demystify MiniDump files on Windows 11, explaining their technical aspects, practical applications, and how you can leverage them to maintain a healthier, more reliable computing experience. We’ll cover everything from configuring their generation to analyzing their contents, empowering you to become a more effective troubleshooter for your Windows 11 system.
Table of contents
Key Takeaways
Before diving into the specifics, here are the core concepts and benefits you’ll gain from understanding MiniDump files on Windows 11:
- MiniDump Definition: MiniDump files are compact snapshots of system memory, capturing vital information during a crash on Windows 11.
- Troubleshooting Power: They are indispensable for diagnosing system instability, identifying problematic software, drivers, or even hardware issues.
- Configuration Control: Users can easily configure Windows 11 to generate MiniDumps through advanced system settings, ensuring diagnostic data is always available.
- Easy Location: MiniDump files are typically stored in a predictable location (
%SystemRoot%\Minidump), making them accessible for analysis. - Analysis Tools: Tools like Windows Debugging Tools (WinDbg) are essential for interpreting the complex data contained within these files.
- Problem Identification: Analyzing MiniDumps helps reveal bug check codes and stack traces, directly pointing to the faulty component or process.
- System Stability: Proactive management and analysis of MiniDump files contribute significantly to maintaining a stable and reliable Windows 11 environment.
What Exactly is a MiniDump File?
At its core, a MiniDump file is a specialized type of crash dump. When your Windows 11 system encounters a critical error that forces it to stop unexpectedly, such as a Blue Screen of Death (BSoD), it attempts to record as much relevant information as possible about the system’s state at that precise moment. This recorded information is then saved to disk as a dump file.
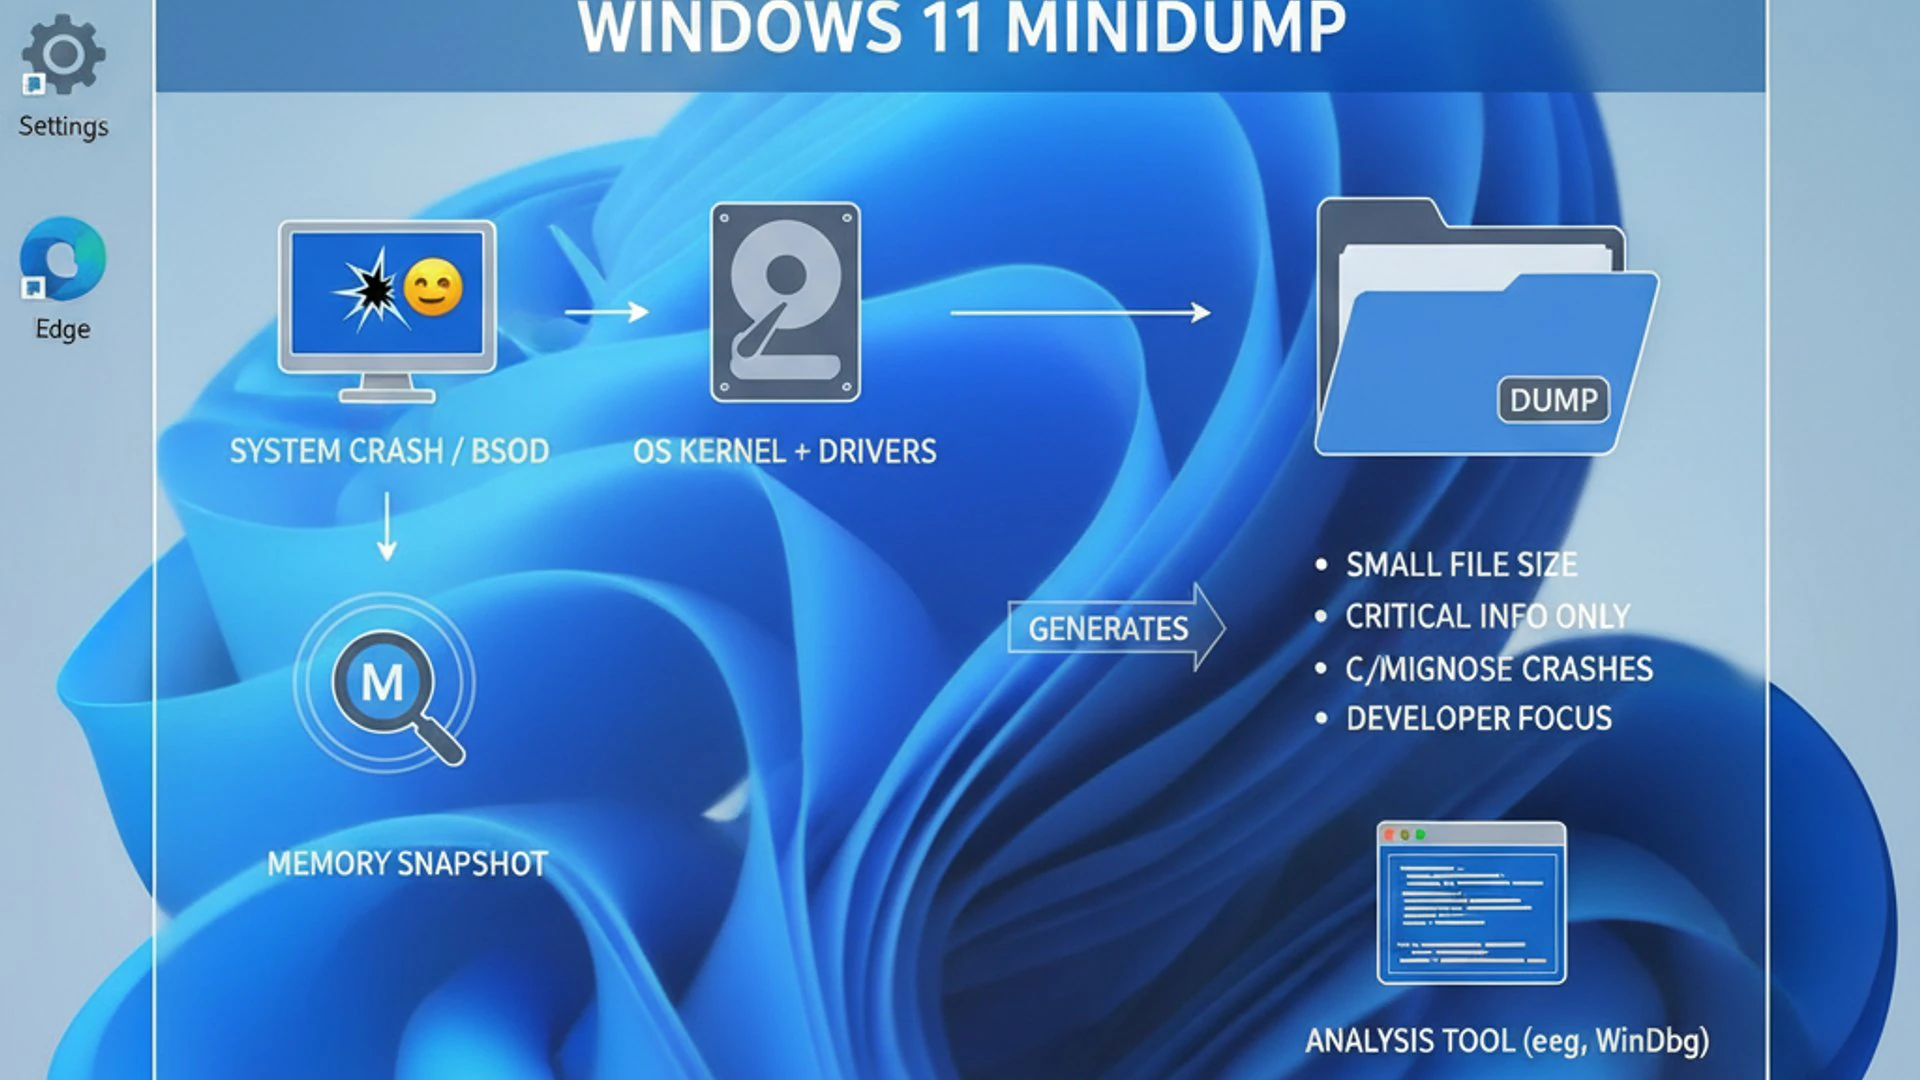
The term “MiniDump” specifically refers to a smaller, more focused version of these diagnostic files. Unlike full memory dumps that capture the entire contents of RAM, MiniDumps are designed to be compact, containing only the most essential data needed for basic debugging. This includes details about the crash, the loaded modules, the running processes, and the kernel stack information.
Their small size makes them particularly useful. They can be quickly generated, consume minimal disk space, and are easier to transfer and analyze, especially for initial triage. For anyone dealing with intermittent system crashes on Windows 11, understanding these files is a fundamental step towards resolution.
The Role of Crash Dumps in System Stability
Crash dumps, including MiniDumps, play a critical role in maintaining and improving system stability. Think of them as the “black box” recorders of your computer. Just as an aircraft’s black box helps investigators understand what went wrong during a flight incident, a crash dump provides developers and advanced users with the data needed to understand why a system failed.
Without crash dumps, diagnosing system failures would be largely based on guesswork. A user might report “my computer crashed,” but this provides little actionable information. A MiniDump, however, can reveal the exact error code, the driver that caused the crash, or even the specific line of code within a program that led to the instability.
This diagnostic capability is vital for software developers to patch bugs, for hardware manufacturers to update drivers, and for end-users to identify conflicting applications or faulty components. By analyzing these files, we can move beyond mere symptoms to address the underlying causes, leading to a more robust and reliable Windows 11 experience.
Types of Crash Dumps: Full, Kernel, and Mini
Windows 11 supports several types of crash dumps, each differing in size and the amount of information they capture. Understanding these distinctions helps in choosing the appropriate setting for your troubleshooting needs.
- Complete Memory Dump (Full Dump): This is the largest type, capturing the entire contents of physical memory at the time of the crash. It requires a paging file at least as large as your physical RAM plus 1MB. While it provides the most comprehensive data, its significant size can make it impractical for routine use or systems with limited storage.
- Kernel Memory Dump: This dump type records only the kernel-mode memory, which includes memory allocated to the Windows kernel and hardware abstraction layer (HAL), as well as drivers and other kernel-mode programs. It excludes user-mode memory, making it smaller than a complete dump but still very informative for kernel-related issues.
- Small Memory Dump (MiniDump): As discussed, this is the most compact option. It includes only essential information: the stop code, parameters, a list of loaded device drivers, the processor context for the crashing processor, and the kernel stack for the crashing thread. Its small size (typically a few hundred kilobytes) makes it ideal for initial troubleshooting and sharing.
Choosing the right dump type is crucial. For most everyday troubleshooting on Windows 11, a Small Memory Dump provides sufficient information without consuming excessive disk space or requiring lengthy generation times.
Why MiniDump Files are Crucial for Windows 11 Troubleshooting
The diagnostic power of MiniDump files cannot be overstated when it comes to maintaining a healthy Windows 11 system. They transform vague symptoms like “my computer keeps crashing” into concrete data points that can be analyzed. This shift from anecdotal evidence to technical specifics is what makes effective troubleshooting possible.
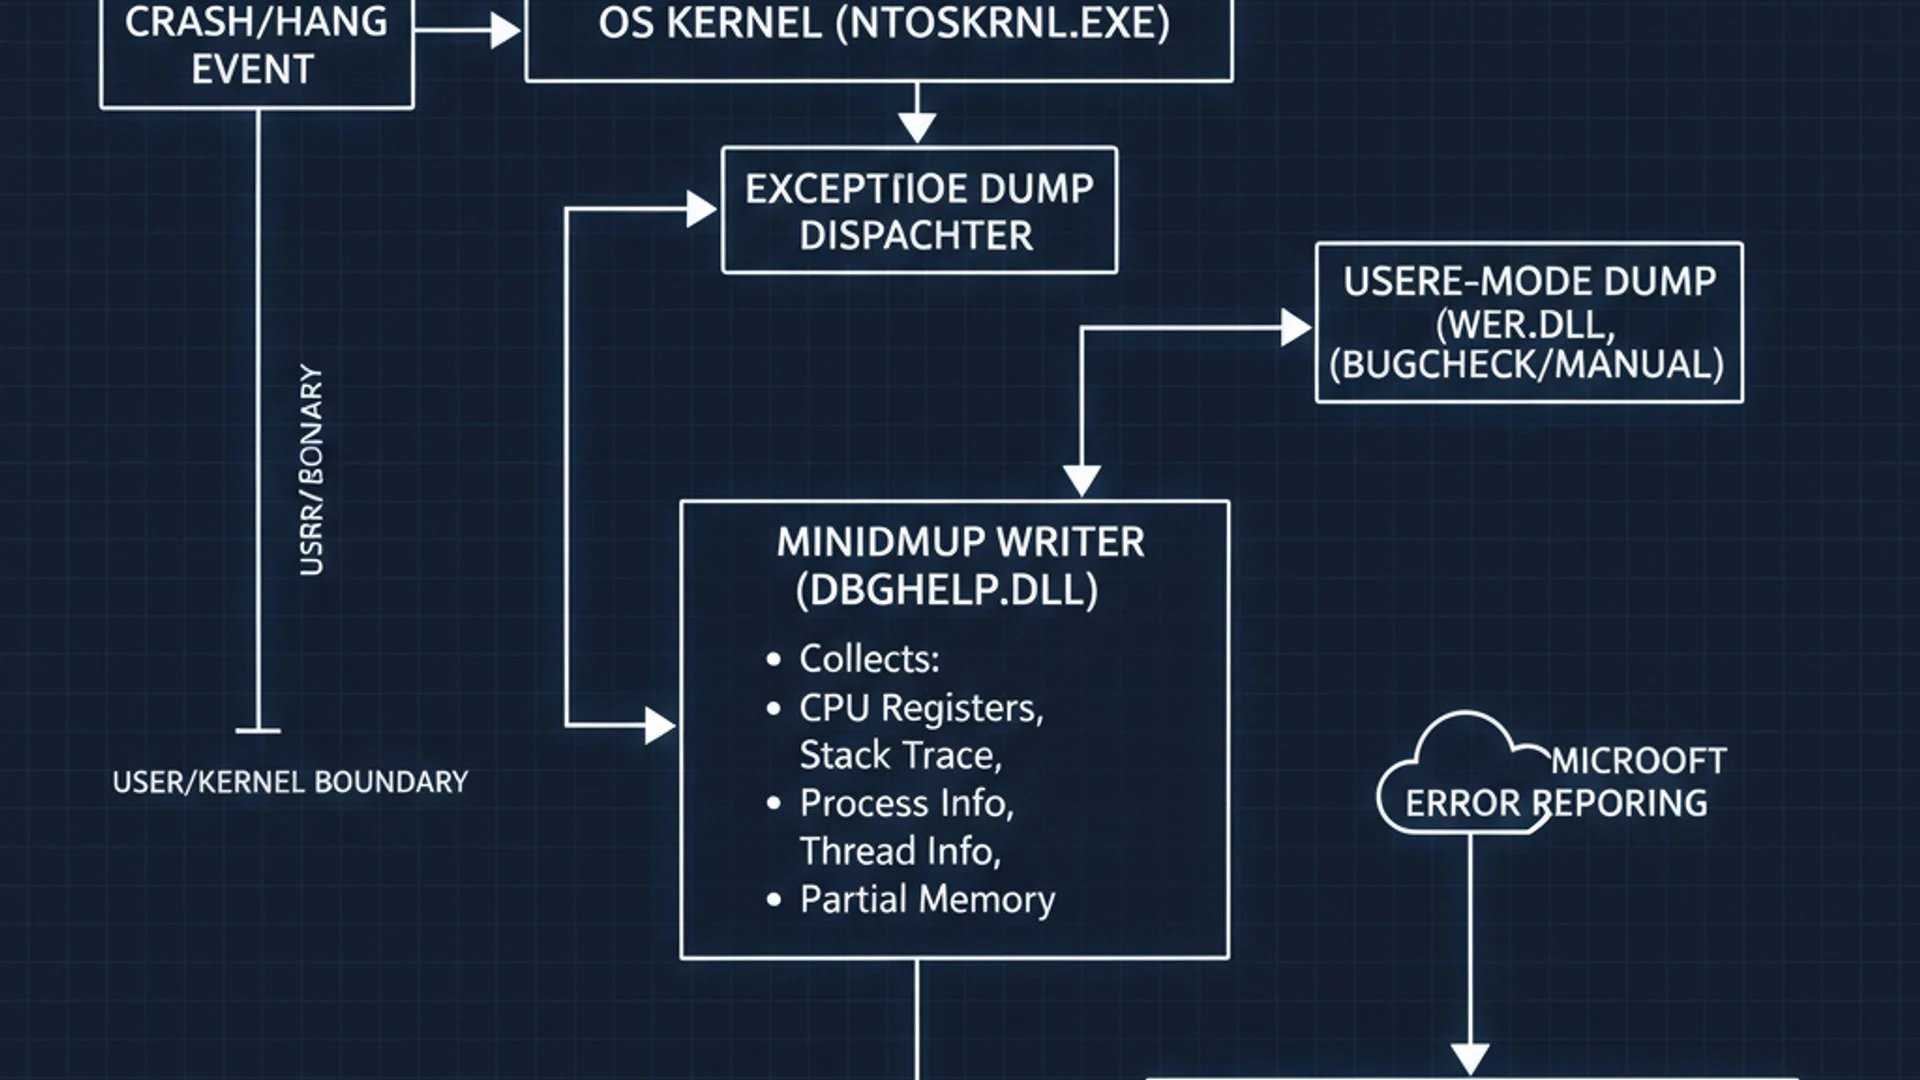
When your system experiences a BSoD, it’s not just an inconvenience; it’s a critical alert that something is fundamentally wrong. MiniDump files capture the details of this alert, allowing you to understand the specific error code (known as a bug check code) and the circumstances surrounding the failure. This information is the first step in formulating a solution, rather than blindly attempting various fixes.
For instance, a MiniDump might reveal that a particular driver is consistently causing system instability. With this knowledge, you can then focus your efforts on updating, rolling back, or even replacing that specific driver, rather than spending hours reinstalling software or checking hardware components unnecessarily. This targeted approach saves significant time and effort in resolving issues on Windows 11.
Identifying Software and Driver Conflicts
One of the most common applications of MiniDump analysis is in uncovering conflicts between software applications or faulty device drivers. Windows 11 relies heavily on drivers to communicate with hardware components, and a poorly written or incompatible driver can quickly lead to system crashes.
A MiniDump file will often point directly to the driver file (e.g., nvlddmkm.sys for NVIDIA graphics, rtwlane.sys for Realtek Wi-Fi) that was active during the crash. This immediate identification allows you to take specific action, such as downloading the latest driver from the manufacturer’s website, rolling back to a previous stable version, or even uninstalling the problematic driver temporarily to confirm it’s the culprit.
Similarly, certain software applications can interfere with system processes or other programs, leading to crashes. While MiniDumps are primarily focused on kernel-mode errors, they can sometimes provide clues about user-mode applications that trigger these kernel issues. Identifying these software conflicts is key to ensuring a smooth and stable operation of your Windows 11 environment.
Pinpointing Hardware Malfunctions
While MiniDumps are memory snapshots, they can indirectly help in diagnosing hardware malfunctions. A persistent pattern of crashes, especially those with specific bug check codes (e.g., MEMORY_MANAGEMENT, KERNEL_DATA_INPAGE_ERROR), can often indicate underlying hardware problems, particularly with RAM, storage drives, or even the CPU.
For example, if MiniDumps consistently show errors related to memory access, it might suggest faulty RAM modules. Similarly, repeated crashes during disk-intensive operations could point to a failing solid-state drive (SSD) or hard disk drive (HDD). The dump file provides the initial symptom, guiding you towards hardware diagnostic tools like MemTest86 for RAM or CrystalDiskInfo for storage drives.
By correlating the information from MiniDumps with other diagnostic tests, users can effectively narrow down the potential source of hardware instability. This systematic approach, starting with the insights from a MiniDump Windows 11 generates, is far more efficient than randomly swapping out components.
Configuring MiniDump Settings on Windows 11
Before you can analyze MiniDump files, your Windows 11 system needs to be configured to generate them. By default, Windows 11 is usually set to create a “Small memory dump,” but it’s always a good idea to verify and understand these settings. This ensures that when a crash occurs, the crucial diagnostic data is actually saved.
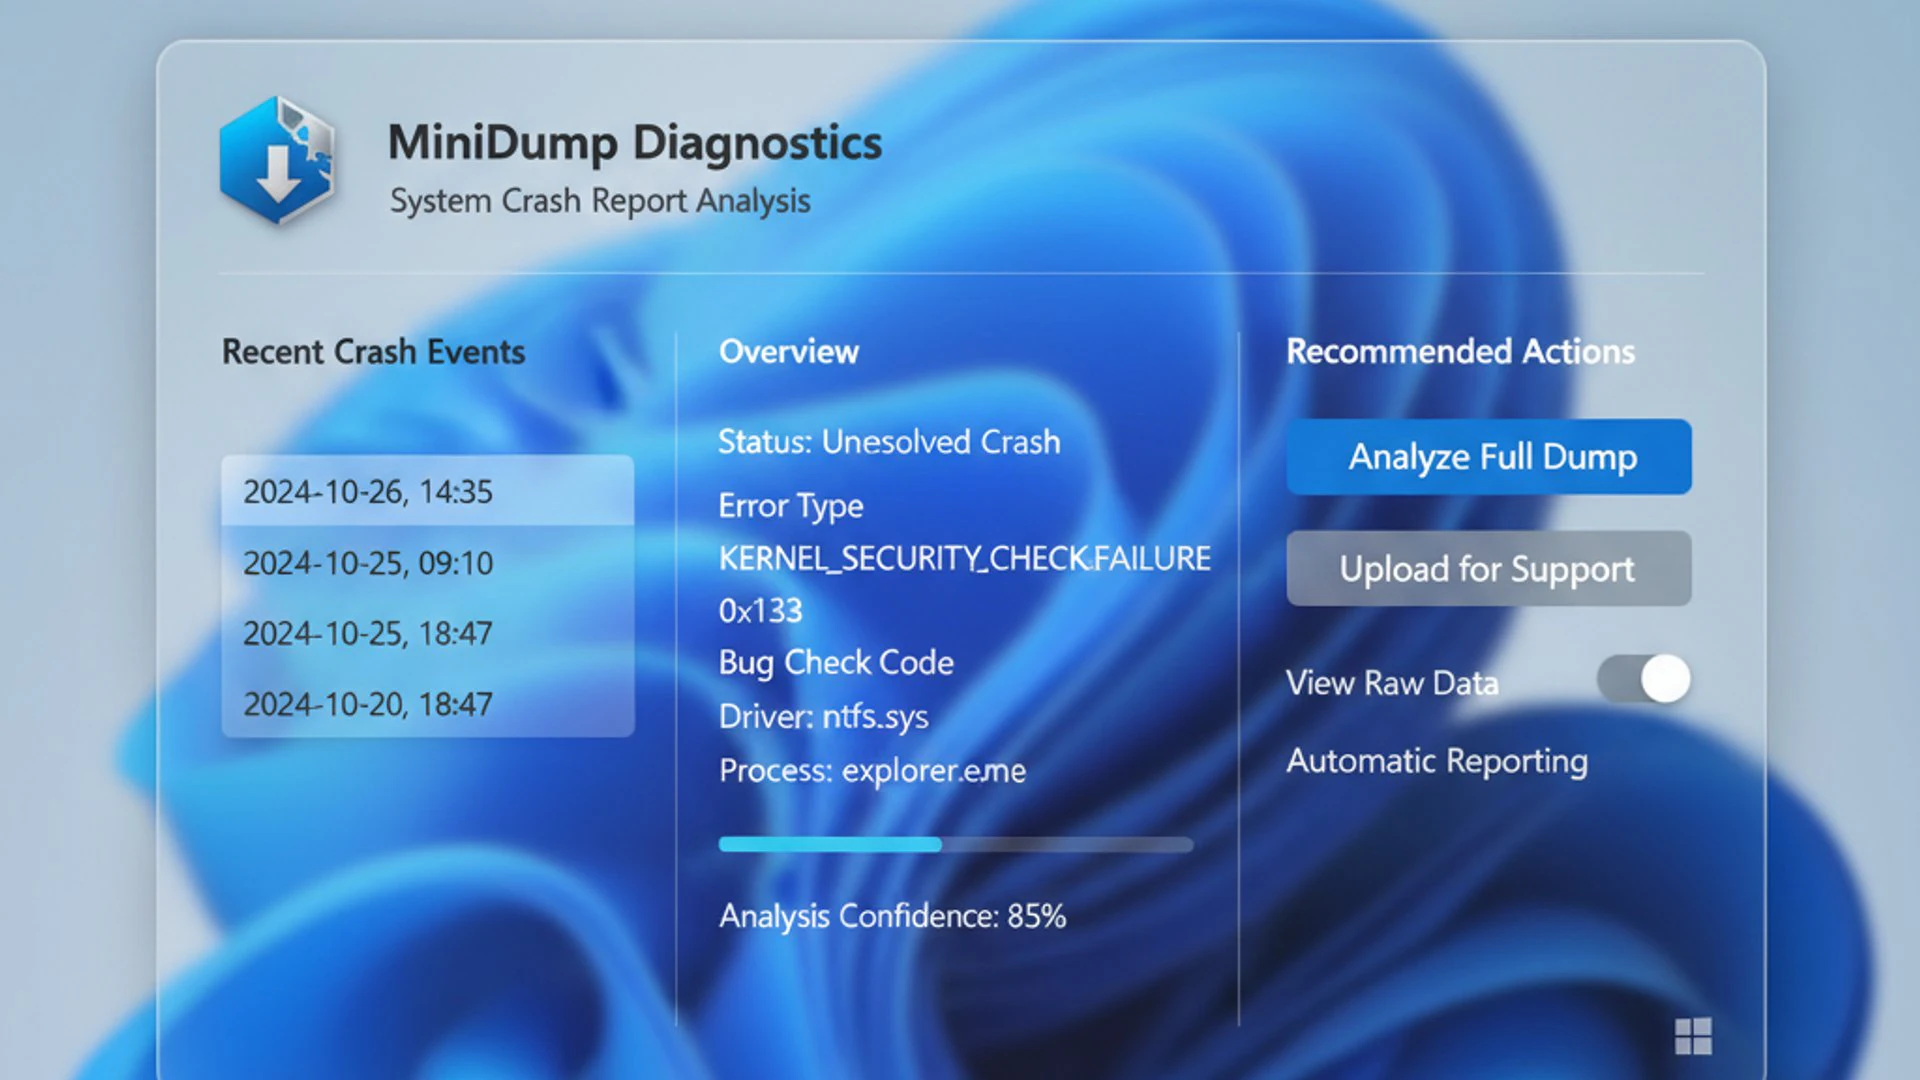
The configuration process involves navigating through the advanced system settings, which might seem intimidating at first glance, but it’s a straightforward procedure. Properly setting these options is a proactive step towards effective troubleshooting. Without these settings correctly configured, a system crash might happen without leaving any diagnostic trace, making problem resolution significantly harder.
It’s important to ensure that your system has enough free disk space for these files, although MiniDumps are very small. Regularly checking these settings, especially after major Windows updates or system changes, can prevent future headaches when trying to diagnose an unexpected crash.
Accessing Advanced System Settings
To configure MiniDump settings, you’ll need to access the Advanced System Settings on your Windows 11 PC. Here’s how:
- Press Windows Key + R to open the Run dialog.
- Type
sysdm.cpland press Enter. This will open the System Properties window directly. - Alternatively, you can right-click on the Start button, select System, then scroll down and click on Advanced system settings on the right pane.
- In the System Properties window, navigate to the Advanced tab.
- Under the “Startup and Recovery” section, click on the Settings… button.
This “Startup and Recovery” dialog box is where you control how your system behaves during startup and, more importantly for our discussion, how it handles system failures and crash dump generation.
Navigating to Startup and Recovery Options
Once you click the “Settings…” button in the “Startup and Recovery” section, a new window will appear. This window contains several options related to system startup, system failure, and debugging information. It’s here that you’ll define the type of crash dump Windows 11 will generate.
In this dialog, you’ll see checkboxes for “Time to display list of operating systems” and “Time to display recovery options when needed.” Below these, the “System failure” section is what we’re interested in. This section dictates what actions Windows 11 takes if a critical system error occurs.
- Ensure the “Write an event to the system log” checkbox is selected. This logs the crash event in the Event Viewer.
- The “Automatically restart” option is generally enabled by default. You might want to temporarily disable this if you need to see the BSoD error message for longer.
The most critical part for MiniDump generation is the “Write debugging information” dropdown menu.
Understanding Dump File Options
The “Write debugging information” section provides several choices for the type of dump file Windows 11 will create upon a system crash. Each option collects a different amount of data, impacting file size and diagnostic depth.
- None: No debugging information is written. This is not recommended for troubleshooting.
- Small memory dump (256 KB): This is the default and most recommended option for general troubleshooting. It creates a compact file containing essential crash information.
- Kernel memory dump: Captures kernel-mode memory. Larger than a MiniDump, but smaller than a complete dump. Useful for more in-depth kernel-related issues.
- Complete memory dump: Captures the entire contents of physical memory. Requires a large paging file and significant disk space. Typically used by developers or advanced IT professionals for complex debugging.
- Automatic memory dump: Windows automatically selects the best dump type based on system conditions and available paging file size. This is a good balance for many users.
For most users and common troubleshooting scenarios, the Small memory dump is the optimal choice due to its balance of information and minimal resource consumption.
Choosing the Right Dump File Type (Small Memory Dump)
For the purpose of general troubleshooting and identifying the cause of most BSoD errors on Windows 11, the Small memory dump (256 KB) option is highly recommended. Here’s why:
- Efficiency: It’s quick to generate and saves significant disk space, making it practical for systems with limited storage or for users who experience frequent crashes.
- Sufficient Information: Despite its small size, a MiniDump contains enough critical data—such as the bug check code, parameters, and the stack trace of the crashing thread—to identify the faulty driver or component in the vast majority of cases.
- Ease of Sharing: Its compact nature makes it easy to upload to online forums or share with support personnel if you need assistance with analysis.
To set this option:
- In the “Startup and Recovery” dialog, click the dropdown menu under “Write debugging information.”
- Select Small memory dump (256 KB).
- Ensure the “Small dump directory” field points to
%SystemRoot%\Minidump(this is the default and generally preferred location). - Click OK to save your changes, then OK again on the System Properties window.
Your Windows 11 system is now configured to generate MiniDumps whenever a critical system error occurs.
Locating MiniDump Files on Your Windows 11 System
Once your Windows 11 system is configured to generate MiniDump files, knowing where to find them is the next crucial step. These files are not immediately visible in common user folders; they are stored in a specific system directory. Accessing them is straightforward, but it requires navigating to the correct location.
The default location is designed to keep these diagnostic files organized and separate from user data, preventing accidental deletion. Understanding this location is vital for anyone who plans to analyze these files, whether using dedicated debugging tools or simply archiving them for later review. If you’re encountering repeated system crashes, checking this folder after an incident is your first step towards diagnosis.
While the default location is usually sufficient, there might be scenarios where you need to change it, perhaps due to disk space constraints on your primary drive or for organizational purposes. This section will guide you through both finding the default location and modifying it if necessary, ensuring you always know where your MiniDump Windows 11 files reside.
Default Directory for MiniDump Files
By default, Windows 11 stores MiniDump files in a dedicated subfolder within the main Windows directory. This location is consistent across most Windows installations, making it easy to locate.
The standard default location for MiniDump files is:
C:\Windows\Minidump
Here’s how you can access this folder:
- Open File Explorer (press Windows Key + E).
- Navigate to the C: drive (or whichever drive Windows 11 is installed on).
- Open the Windows folder.
- Inside the Windows folder, you will find a subfolder named Minidump.
Each MiniDump file typically has a filename format like MMDDYY-XXXXX-YY.dmp, where MMDDYY represents the date of the crash, and XXXXX-YY are unique identifiers. These files are typically very small, usually around 256 KB each, as configured for a small memory dump.
Changing the MiniDump File Location
While the default location is generally fine, there might be situations where you need to change where Windows 11 saves its MiniDump files. For example, if your C: drive is running low on space or if you prefer to store all diagnostic files on a separate partition or drive.
You can modify the MiniDump file location through the same “Startup and Recovery” settings we accessed earlier:
- Follow the steps to navigate to System Properties > Advanced tab > Startup and Recovery > Settings…
- In the “Startup and Recovery” dialog box, locate the “Small dump directory” field.
- By default, this field will show
%SystemRoot%\Minidump. You can change this path to any valid directory on your system. For example, you could change it toD:\CrashDumps. - Important: Ensure the directory you specify already exists. Windows will not create the directory for you. You must manually create the folder (e.g.,
D:\CrashDumps) before changing the setting. - Click OK to save your changes, then OK again on the System Properties window.
After making this change, any future MiniDumps generated by your Windows 11 system will be saved to the new specified location. This flexibility allows for better management of diagnostic data according to your system’s configuration and personal preferences.
Analyzing MiniDump Files: Tools and Techniques
Locating MiniDump files is only half the battle; the real power comes from analyzing their contents. These files are not human-readable in their raw form; they require specialized tools to interpret the complex binary data they contain. The primary tool for this task is the Windows Debugging Tools, specifically WinDbg.
Analyzing a MiniDump file involves more than just opening it; it requires understanding bug check codes, stack traces, and how to use debugger commands to navigate through the memory snapshot. This process can seem daunting initially, but with a basic understanding of the tools and techniques, even non-developers can gain significant insights into system crashes on Windows 11.
This section will guide you through installing WinDbg, performing a basic analysis, and interpreting the critical information presented. Mastering these techniques will transform you from a passive observer of system crashes into an active participant in their resolution, making your Windows 11 experience much more stable.
Using Windows Debugging Tools (WinDbg)
WinDbg (Windows Debugging) is a powerful, free tool provided by Microsoft, designed for debugging various types of applications, drivers, and operating system components. It’s the go-to utility for analyzing crash dump files, including MiniDumps.
While WinDbg has a steep learning curve for advanced debugging, its basic functions for MiniDump analysis are relatively straightforward. It allows you to load a dump file, automatically analyze it, and display the most probable cause of the crash, including the bug check code and the responsible module or driver.
For effective MiniDump analysis, WinDbg is an indispensable tool, offering deep insights into the root causes of system crashes on Windows 11.
Its ability to symbolize the raw memory addresses into human-readable module names and function calls is what makes it so powerful. Without it, a MiniDump would just be a collection of hexadecimal numbers.
Installing and Setting Up WinDbg
To install WinDbg, you’ll need to download the “Windows SDK” which includes the debugging tools. Here’s how:
- Go to the official Microsoft website to download the Windows SDK. Search for “Windows SDK” or visit Microsoft’s SDK download page.
- Download the installer for the latest version of the Windows SDK.
- Run the installer. During the installation process, you’ll be presented with a list of features to install. You only need to select “Debugging Tools for Windows”. You can deselect all other components to minimize the installation size.
- Complete the installation.
- Once installed, you can find WinDbg Preview in your Start Menu. It’s recommended to use the “Preview” version as it has a more modern interface.
Before analyzing dumps, you need to configure WinDbg to use Microsoft’s symbol servers. Symbols are essential for WinDbg to translate raw memory addresses into meaningful function names and module information. In WinDbg Preview, go to File > Settings > Debugging settings and add srv*C:\Symbols*https://msdl.microsoft.com/download/symbols to the “Symbol path” field. Create the C:\Symbols folder first.
Basic Commands for MiniDump Analysis
After installing WinDbg and configuring symbol paths, you can now open and analyze a MiniDump file. Here are the basic steps and commands:
- Open WinDbg Preview from your Start Menu.
- Click File > Open dump file… (or press Ctrl+D).
- Navigate to your MiniDump directory (e.g.,
C:\Windows\Minidump) and select the.dmpfile you want to analyze. - Once the dump file is loaded, WinDbg will start processing it. It might take a moment to download symbols.
- After loading, type the command
!analyze -vin the command line at the bottom of the WinDbg window and press Enter. This command performs a verbose analysis of the dump file.
The output of !analyze -v will be extensive, but you’ll want to focus on key sections. Look for “BUGCHECK_CODE”, “MODULE_NAME”, “IMAGE_NAME”, and the “STACK_TEXT” section. These will provide the most direct clues regarding the crash.
Interpreting Bug Check Codes and Stack Traces
The output from !analyze -v can be overwhelming, but two pieces of information are paramount: the Bug Check Code and the Stack Trace.
- Bug Check Code: This is a hexadecimal number (e.g.,
0x000000D1,0x0000003B) that uniquely identifies the type of system crash. WinDbg will usually provide a symbolic name for it, such asDRIVER_IRQL_NOT_LESS_OR_EQUALorSYSTEM_SERVICE_EXCEPTION. You can search for these codes online (e.g., “0x000000D1 Windows 11”) to get more detailed explanations from Microsoft’s documentation or community forums. - Stack Trace: This section shows the sequence of function calls that led up to the crash. It’s like a breadcrumb trail, revealing which functions were active and in what order. Look for the first few entries in the stack that are not part of core Windows system files (like
ntoskrnl.exeorhal.dll). Often, the module listed just before the system files in the stack trace is the culprit.
For example, if the stack trace shows nvlddmkm.sys (NVIDIA graphics driver) just before ntoskrnl.exe, it strongly suggests a problem with your graphics driver. Similarly, rtwlane.sys would point to a Realtek Wi-Fi driver issue.
By combining the bug check code’s general description with the specific module identified in the stack trace, you can often pinpoint the exact driver, software, or even hardware component causing your Windows 11 system to crash.
Common Scenarios Leading to MiniDump Generation
MiniDump files are not generated for every minor hiccup in Windows 11. They are specifically reserved for critical system failures that cause the operating system to halt unexpectedly. Understanding these common scenarios helps users anticipate when a MiniDump might be created and what kind of issues it could potentially reveal.
The most infamous scenario is the Blue Screen of Death, a clear indicator of a critical system error. However, MiniDumps can also be triggered by severe application crashes or system freezes that escalate to a point where the operating system can no longer recover gracefully. Recognizing these situations empowers you to connect the visible symptom with the underlying diagnostic evidence.
Knowing these common triggers also reinforces the importance of configuring your system to generate MiniDumps. Without them, these critical events would leave no trace, making effective troubleshooting nearly impossible. Thus, being aware of when a MiniDump Windows 11 file is likely to appear is crucial for proactive system maintenance.
Blue Screen of Death (BSoD) Errors
The Blue Screen of Death (BSoD) is arguably the most well-known and dramatic indicator of a critical system failure. When a BSoD occurs, Windows 11 displays a full-screen error message, often with a sad face emoji, indicating that your PC ran into a problem and needs to restart. This is the primary event that triggers the generation of a MiniDump file.
BSoDs are caused by unrecoverable errors in the kernel mode, which means a critical part of the operating system or a driver has encountered an issue it cannot resolve. Common causes include:
- Faulty or incompatible device drivers.
- Corrupted system files.
- Hardware malfunctions (e.g., RAM, hard drive, CPU overheating).
- Conflicts between software applications or security programs.
Each BSoD typically comes with a specific stop code (e.g., DRIVER_IRQL_NOT_LESS_OR_EQUAL, KERNEL_SECURITY_CHECK_FAILURE), which is prominently displayed on the blue screen. This code is also recorded in the MiniDump, providing the first critical clue for analysis. If you see a BSoD, you can be confident that a MiniDump has been created (assuming your settings are correct).
Application Crashes and Freezes
While BSoDs are the most direct cause of MiniDump generation, severe application crashes or prolonged system freezes can also lead to them. If an application crashes in a way that corrupts kernel memory or causes a deadlock that the operating system cannot resolve, it can escalate into a full system crash, resulting in a BSoD and subsequent MiniDump.
For instance, a graphics-intensive game crashing repeatedly might eventually trigger a BSoD related to a graphics driver. Similarly, a poorly coded utility or a malicious program that attempts to access protected memory regions could force a system shutdown. In these cases, the MiniDump will capture the state of the system at the point of failure, even if the initial problem originated in user-mode software.
Not all application crashes will lead to a MiniDump; many simply result in the application closing unexpectedly. However, if an application crash consistently leads to a system-wide freeze or a BSoD, then analyzing the generated MiniDump Windows 11 file becomes essential for identifying the problematic software or its interaction with system drivers.
Best Practices for Managing MiniDump Files
Generating and analyzing MiniDump files is a powerful troubleshooting technique, but effective management of these files is equally important. Over time, these diagnostic files can accumulate, and knowing how to handle them responsibly ensures you have the data you need without cluttering your system or wasting valuable disk space.
Managing MiniDump files involves a balance between retaining useful diagnostic information and regularly cleaning up outdated or irrelevant data. This section will provide practical advice on how to review, archive, and, when appropriate, delete these files. Implementing these best practices will help you maintain a clean and efficient Windows 11 system while still being prepared for future troubleshooting needs.
Remember, MiniDumps are valuable only if they are accessible and relevant. A folder full of old, unanalyzed dumps from minor, resolved issues offers little benefit. Proactive management ensures that your diagnostic resources are always optimized for current and potential problems, contributing to the overall stability of your Windows 11 experience.
Regular Review and Archiving
It’s a good practice to regularly review your C:\Windows\Minidump folder, especially after experiencing a system crash. This allows you to identify new dumps and decide whether they need immediate analysis or archiving.
- Analyze Immediately: If you’ve just experienced a BSoD, analyze the most recent MiniDump as soon as possible. The information is fresh, and you’re actively trying to resolve the issue.
- Archive Important Dumps: If a crash leads to a particularly complex or recurring issue, consider archiving the relevant MiniDumps. You might move them to a separate folder (e.g.,
D:\Archived_Dumps) or even compress them into a ZIP file. This is especially useful if you’re collaborating with support personnel or need to refer back to specific crash patterns. - Document Findings: When you analyze a MiniDump and identify a cause, it’s helpful to document your findings. Note the bug check code, the identified driver, and the steps you took to resolve it. This creates a valuable knowledge base for future troubleshooting.
Regular review ensures that your diagnostic data remains relevant and manageable, preventing the MiniDump folder from becoming a disorganized repository of outdated information.
Disk Space Considerations and Cleanup
While MiniDumps are small, a large number of them can still accumulate over time, especially on systems that experience frequent crashes. Managing disk space is important for overall system performance, and cleaning up old MiniDumps is a simple way to reclaim some space.
- Automatic Cleanup (Disk Cleanup): Windows 11’s built-in Disk Cleanup utility can help remove old dump files.
- Search for “Disk Cleanup” in the Start Menu and run it.
- Select your C: drive (or the drive where Windows is installed).
- Click “Clean up system files”.
- After it scans, scroll through the list and look for “System error memory dump files” and “System error MiniDump files”. Select these options.
- Click OK to delete them.
- Manual Deletion: You can also manually delete files from the
C:\Windows\Minidumpfolder. However, ensure you only delete files that you have already analyzed, archived, or deemed no longer necessary. Avoid deleting the entire Minidump folder itself, as Windows will recreate it if needed. - Consider Storage Location: If disk space on your primary drive is a constant concern, consider changing the MiniDump storage location to a larger secondary drive, as discussed earlier.
By regularly reviewing and cleaning up your MiniDump files, you ensure that your system remains uncluttered while still retaining the ability to diagnose critical issues effectively. This proactive approach to managing diagnostic data is a key aspect of maintaining a healthy Windows 11 system.
Conclusion: Leveraging MiniDump for a Stable Windows 11 Experience
MiniDump files, though often overlooked, are an incredibly powerful and indispensable resource for anyone seeking to understand and resolve system instabilities on Windows 11. They act as the silent witnesses to your system’s critical failures, providing the detailed forensic data needed to move beyond mere symptoms and pinpoint the root cause of crashes.
From configuring your system to generate these vital snapshots to mastering the basics of their analysis with tools like WinDbg, the knowledge gained empowers you to take control of your computing environment. Identifying problematic drivers, conflicting software, or even hinting at underlying hardware issues becomes a systematic process rather than a frustrating guessing game.
By embracing the practices outlined in this guide—understanding what MiniDumps are, how to configure and locate them, and how to perform basic analysis—you transform from a passive recipient of system errors into a proactive troubleshooter. This proactive approach not only leads to a more stable and reliable Windows 11 experience but also enhances your overall technical proficiency. Ultimately, leveraging MiniDump files is a cornerstone of effective system maintenance and a testament to the depth of diagnostic capabilities available within the Windows ecosystem.
For more interesting articles, stay tuned to Winsides.com!









Community
Comments (0)